Exercise 5 - ML for Robotics
MNIST Dataset and ML basic terminologies
Deliverable 1
Deliverable 2
What data augmentation is used in training? Please delete the data augmentation and rerun the code to compare.
A random rotation of the image between (-5, 5) degrees, then add 2 pixels of padding to the image, and then randomly cropping the image to 28 x 28 pixels. Rerunning the code without data augmentation results in a lower test accuracy, of 97.89% as opposed to 97.99% with data augmentation. This is because data augmentation helps prevent overfitting by increasing the amount of variation in the training data. Removing data augmentation results in a decreased training time of 1 minute 1 seconds as opposed to 1 minute 20 seconds with data augmentation, as less processing is performed.
What is the batch size in the code? Please change the batch size to 16 and 1024 and explain the variation in results.
The batch size in the code is 64. Changing the batch size to 16 results in a decreased test accuracy of 97.94% as opposed to 97.99% with a batch size of 64. This is because a larger batch size results in a batch gradient that is closer to the true gradient, which allows the neural network to converge faster. Changing the batch size to 1024 results in a decreased test accuracy of 97.53%. This is because a larger batch size results in a less stochastic gradient, which can result in the weights converging to a local minimum rather than a minimum closer to the global minimum. Changing the batch size to 16 results in an increased training time of 3 minute and 3 seconds, as we do not fully utilize the GPU. Changing the batch size to 1024 results in a decreased training time of 44 seconds as we utilize the GPU more.
What activation function is used in the hidden layer? Please replace it with the linear activation function and see how the training output differs. Show your results before and after changing the activation function in your written report.
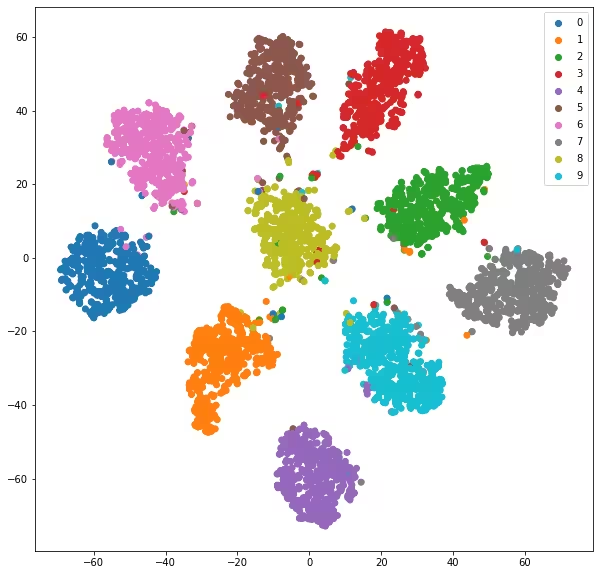
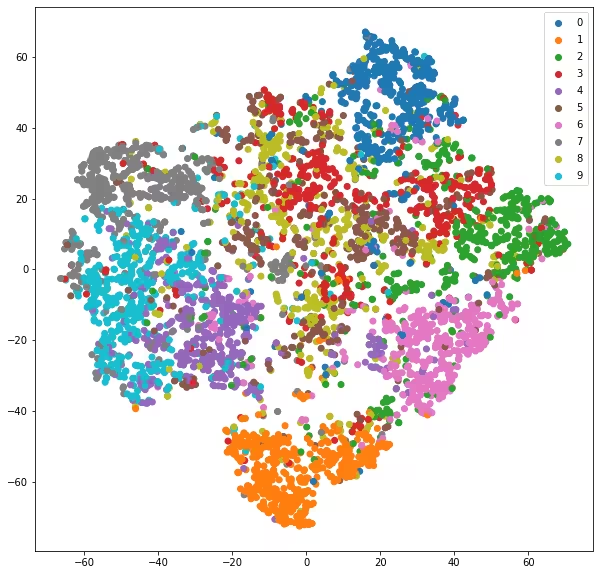
ReLU. Replacing it with the linear activation function results in only 87.02% test accuracy. This is because the activation function has to be non-linear in order to be able to learn a non-linear function. This is really evident in the t-SNE plots below, where using the linear activation function leads to a model that is unable to separate the classes well.
t-SNE before changing the activation function:
t-SNE after changing the activation function:
Changing the activation function to the linear activation function results in the same training time of 1 minute 20 seconds, this is because the ReLU activation function is not that computationally expensive in both the forward and backward passes.
What is the optimization algorithm in the code? Explain the role of optimization algorithm in training process
Adam is an optimization algorithm used in the code. Adam is similar to SGD but it computes adaptive learning rates for each parameter through exponential moving averages of past gradients and the squared gradients. The role of the optimization algorithm is to efficiently update the weights of the neural network to minimize the loss function.
Add dropout in the training and explain how the dropout layer helps in training
Adding dropout (p = 0.2) increased the test accuracy to 98.33%, this is
because dropout is a form of regularization that helps prevent overfitting by
randomly dropping neurons from the neural network during training, this forces
the neural network to learn more robust features.
Adding dropout results in an increased training time of 1 minute 23 seconds as more processing is required.
Number Detection Node
Deliverable 3
In the video below, the terminal on the left prints the detected number along with an array logging all previous detections. The number is the detection per index, so for example in the final array
 0  1  2  3  4  5  6  7  8  9  <-- Which number it is
[2, 1, 3, 1, 1, 4, 1, 2, 3, 3] <-- Number of times we've detected it
5 was detected 4 times, though 1 was only detected once. We didn’t penalize
double-detection in a single drive-by, nor did the route we take expose all the
digits the same amount of times, so the high variance here is understandable.
You can see the position for the april tag coo residing with the detected digit,
relative to the world frame, being published right above the equal-sign
delimited message. The coordinates are transforms for x, y, z respectively.
The camera on the right only publishes a new frame when a new detection is made, which makes it appear really slow. We had to reduce the publishing rate of the detection topic and the apriltag detector, otherwise the load would be too heavy for the duckie, leading to high latency which ruined our detection frames. You can still see the odometry guessing where it is in the rviz transforms visualization.
After we find all the digits, we use a rospy.signal_shutdown() and print a
very explicit message to the terminal. However, since rospy publishers sometimes
get stuck, we force our node to continue publishing 0 velocity messages,
regardless of if rospy already went down. This is very important, otherwise the
wheels don’t stop about half the time, though it does result in a scary red
error message at the end of the video. Don’t worry, rospy was gracefully
shutdown, we just didn’t trust duckietown enough to listen right away, just like
the solution code for lab 3.
Our strategy for detecting the numbers was to use OpenCV to extract the numbers
from the image. From the Wikipedia page on the MNIST
database, we learned that a
2-layer MLP can classify with a 1.6% error rate, thus we decided on using a
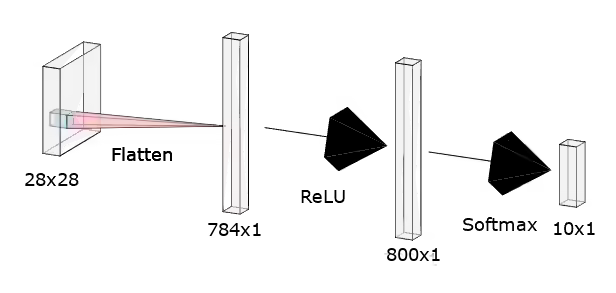
simple MLP to classify the numbers. Our model flattens the 28 x 28 pixel image
into a 784 x 1 vector, which is passed through a 800 x 1 hidden layer with
ReLU activation, and then a 10 x 1 output layer with softmax activation.
Our model architecture diagram created with NN-SVG is shown below:
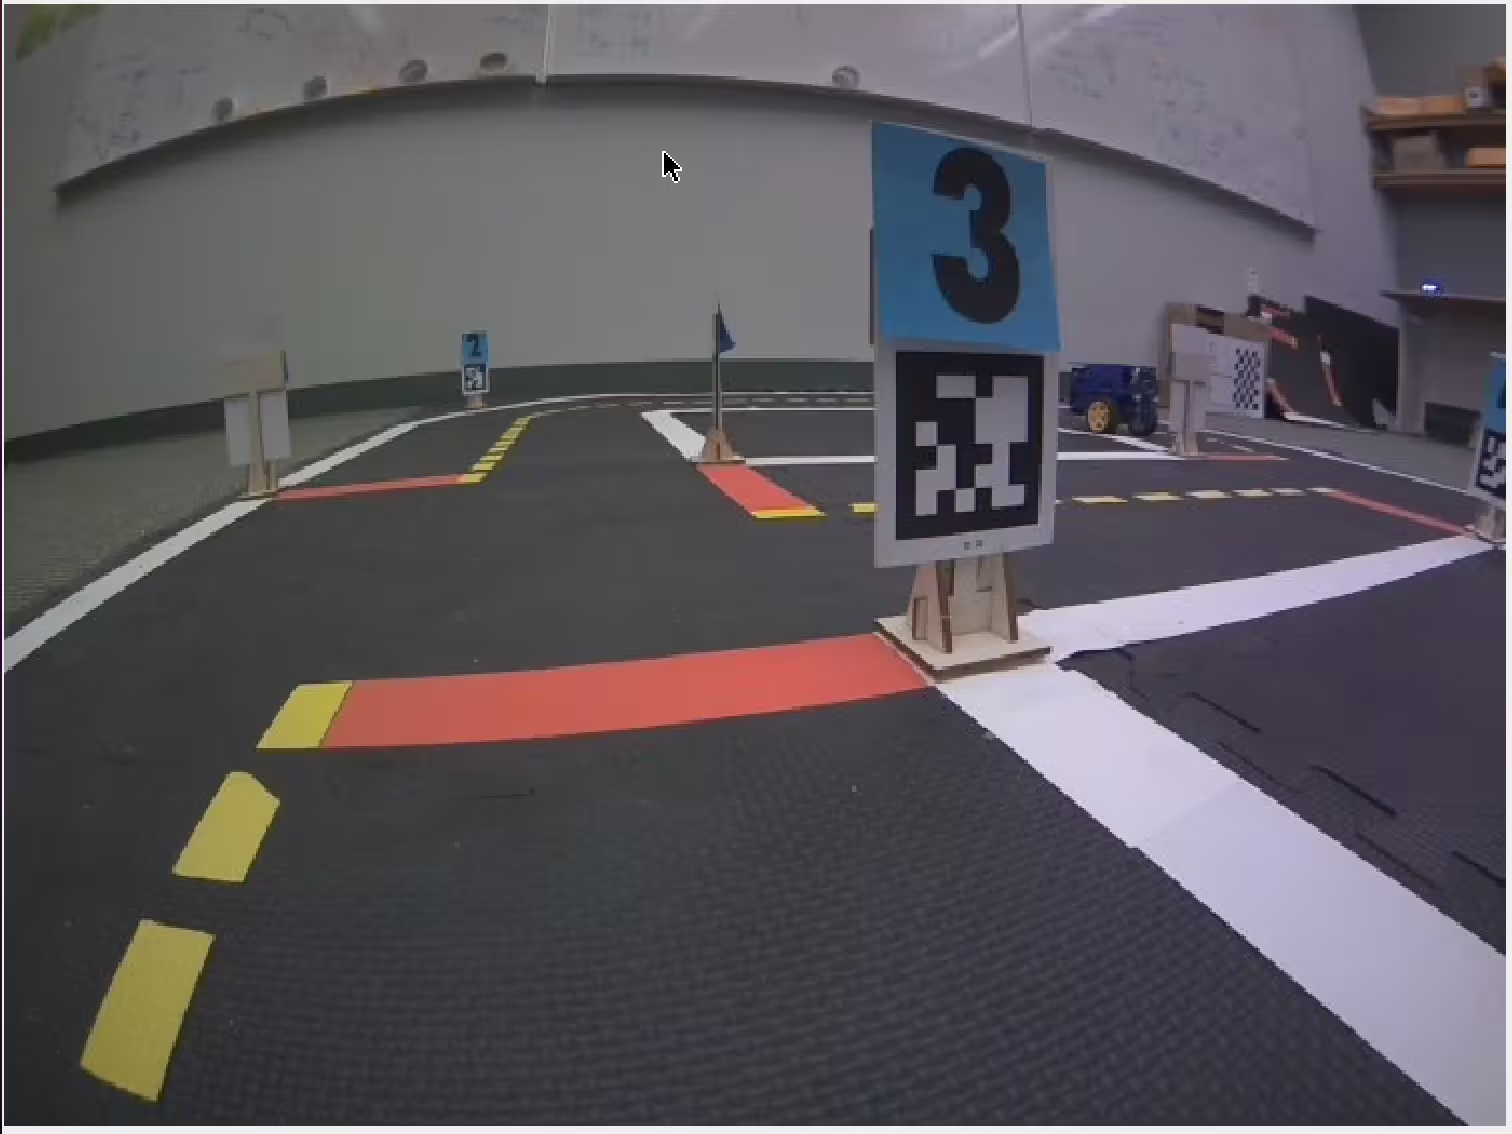
We collected 270 train images and 68 test images of the numbers by saving images from the bot like below:
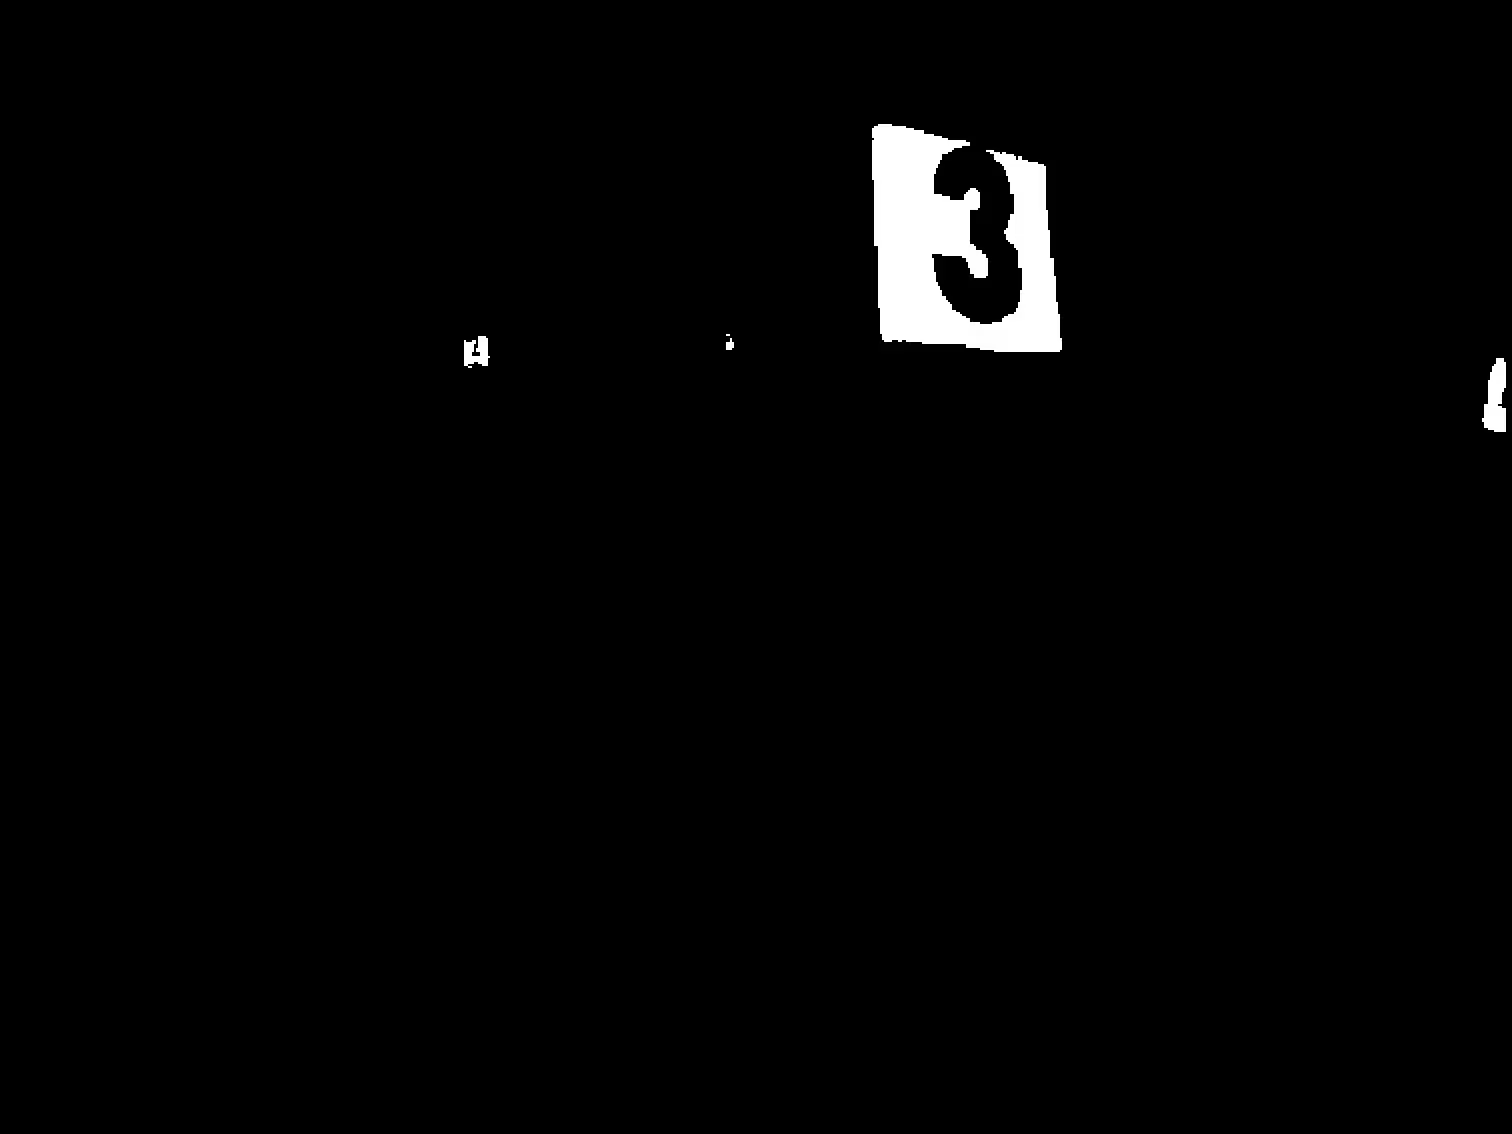
For preprocessing, we first get the blue HSV colour mask of the image to
extract the blue sticky note.
(cv.inRange).
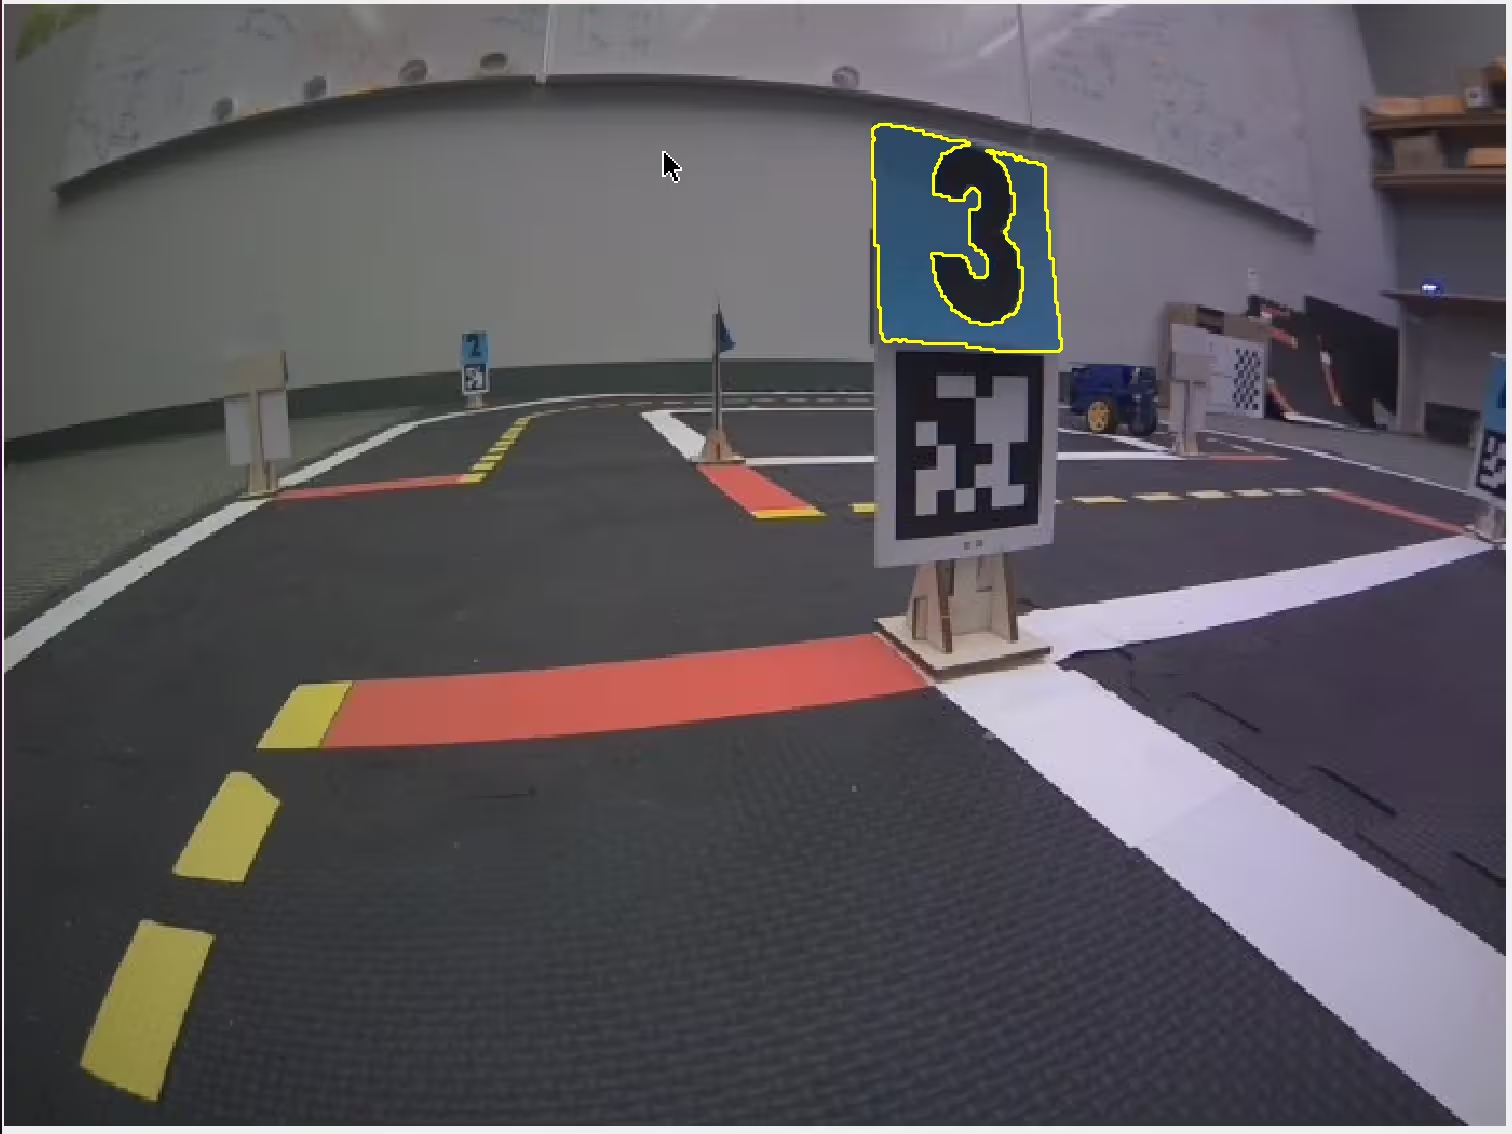
Then, we find the contour (cv.findContours) of the blue sticky note.
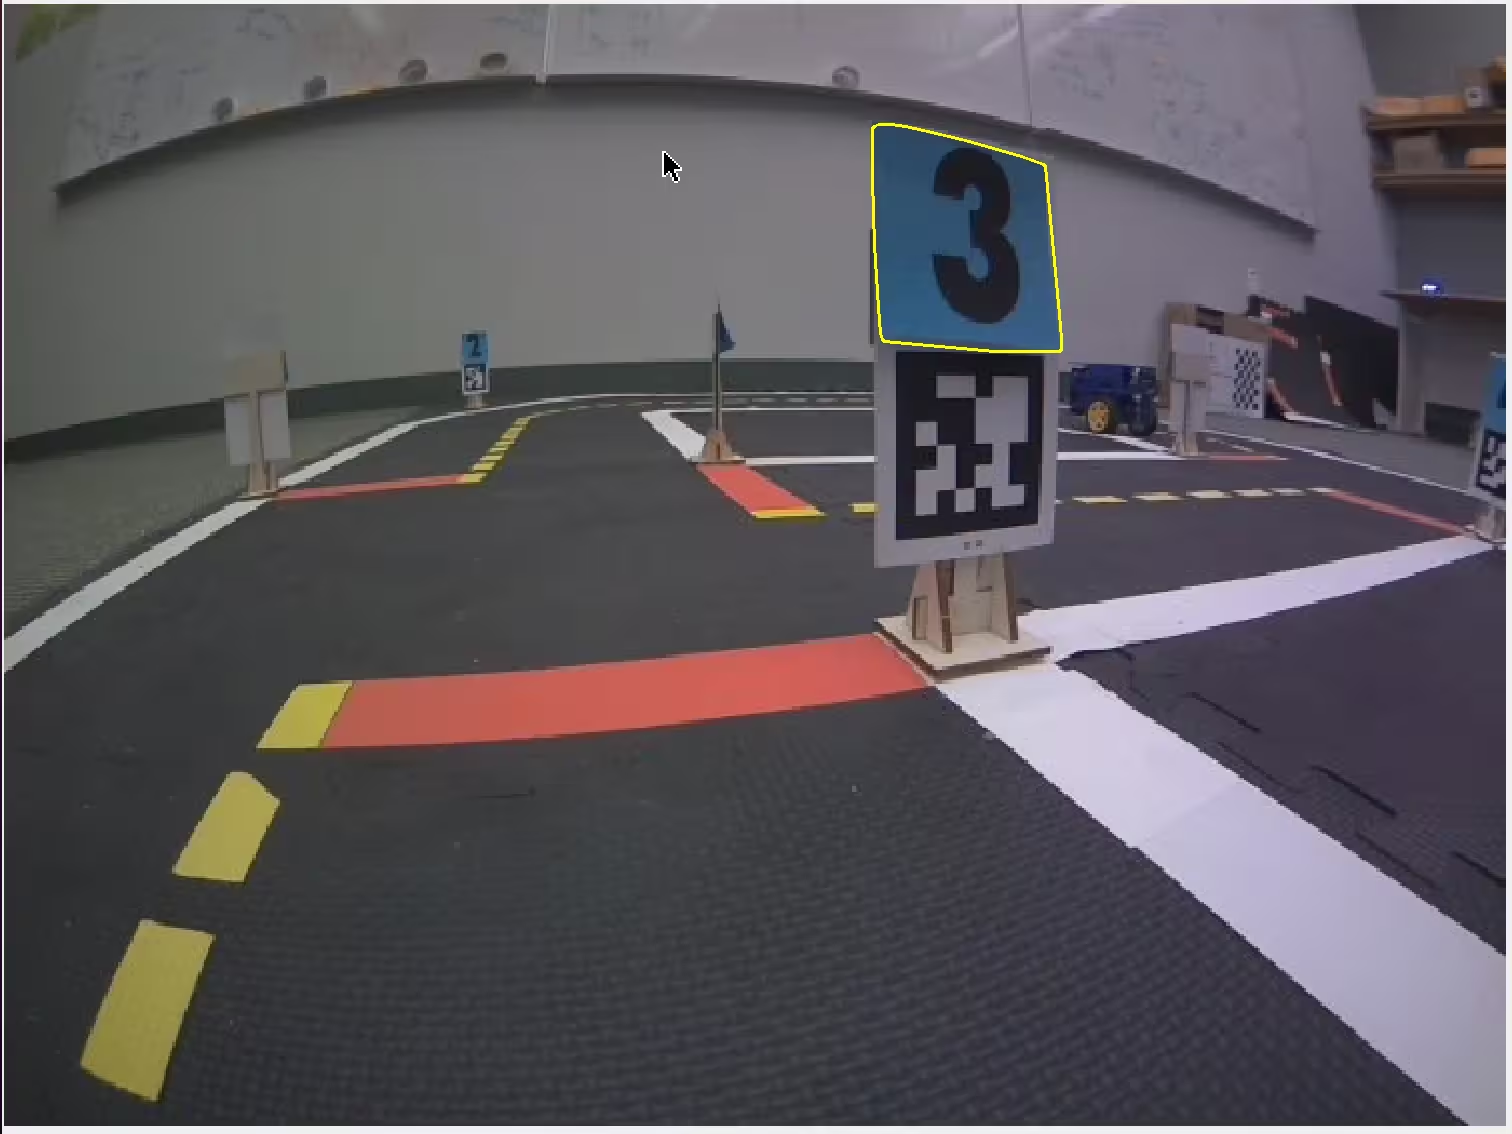
Then, we use OpenCV to get the convex hull of the contour (cv.convexHull).
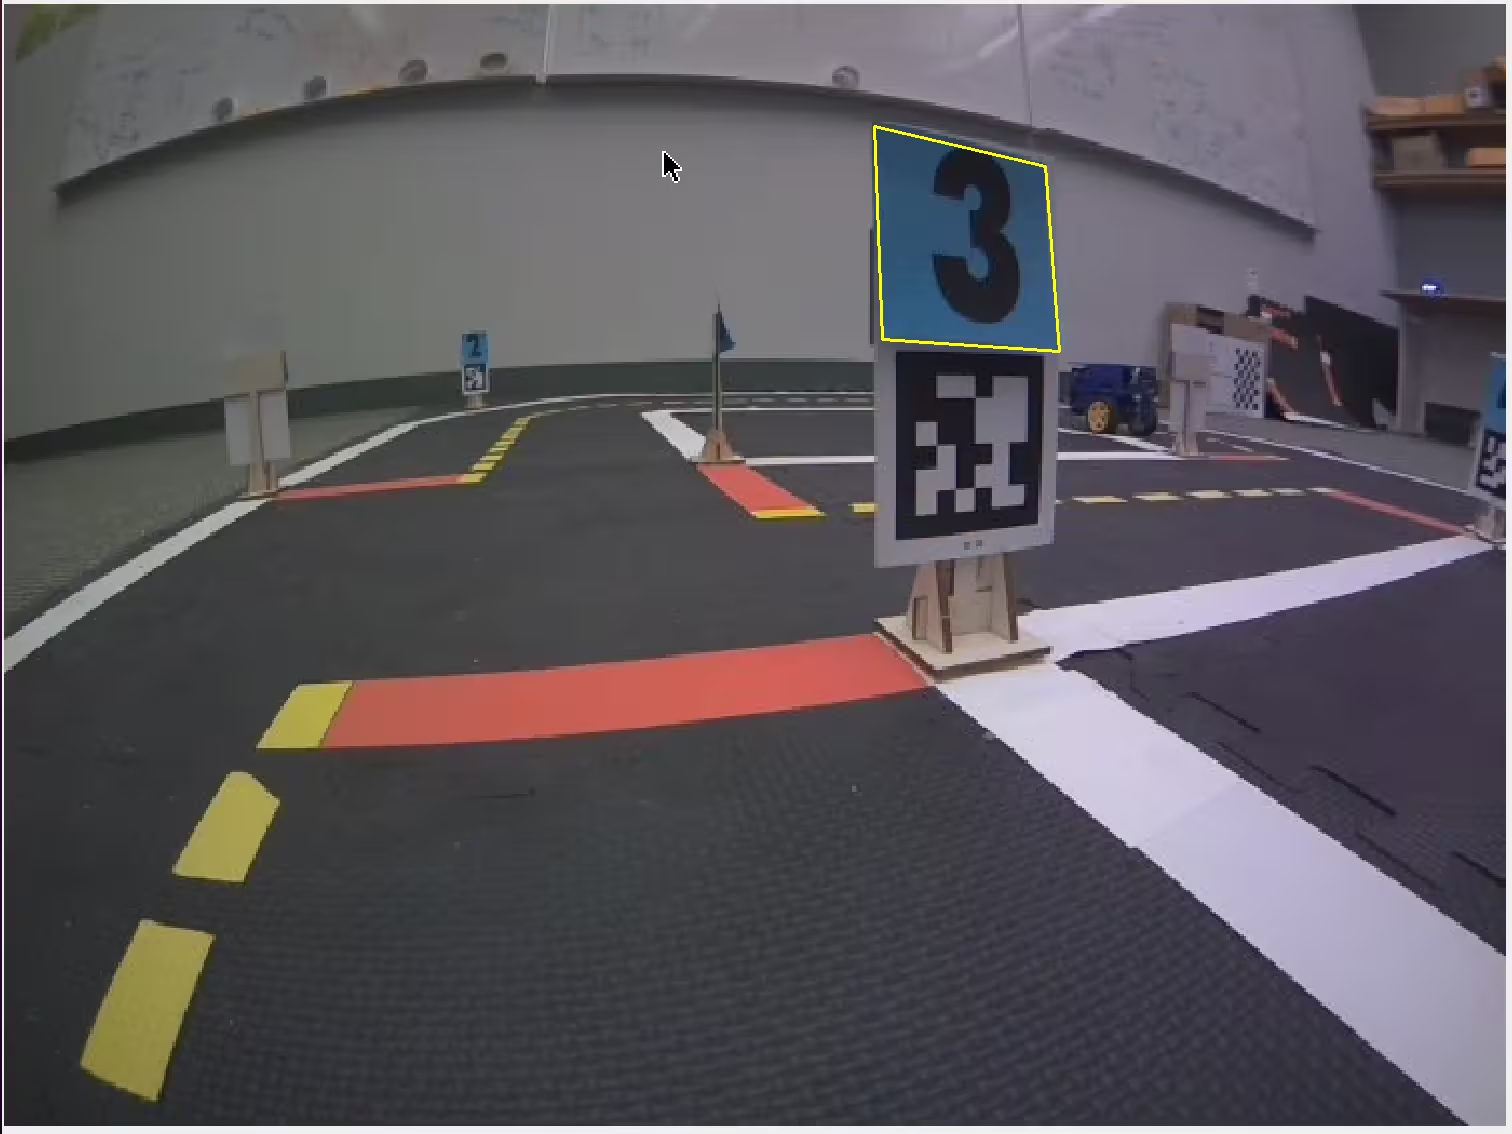
Then, we retrieve the corners of the convex hull using Douglas-Peucker algorithm
(cv.approxPolyDP) suggested by this Stack Overflow answer.
We decided to use binary search to adjust the epsilon
value until we get exactly 4 corners, interestingly, we came up with the same
idea as this Stack Overflow answer.
Using OpenCV we calculate a perspective transform matrix to transform the image to 28 x 28 pixels.

We get the black HSV colour mask of the warped image (cv.inRange) to extract
the number.

To prevent noise from the warping, we set the left and right 2 px borders to 0. Then, we normalize the image to have zero mean and unit variance.
We then trained a MLP using PyTorch on the MNIST dataset as required following this example. Our very simple MLP gets 97% accuracy on MNIST test set. However, it generalizes poorly from handwritten digits to the typed numbers, only achieving an accuracy of 56% on our test set. Therefore, we fine tuned the model on our data, with a reduced initial learning rate of 0.1. After fine tuning on our data, our model achieves 100% accuracy on our data’s test set.
For inference, we apply the same preprocessing steps above, and the we use
numpy to load the weights and manually implement the forward pass of the
neural network with equation:
\[ y = \text{softmax}(W_2 \max(W_1 x + b_1, 0) + b_2) = [0, 0, 0.01, 0.99, 0, 0, 0, 0, 0, 0] \]
Then we get the digit using the argmax of the output of the neural
network.
\[ p = \text{argmax } y = 3\]
How well did your implemented strategy work?
Our strategy for number detection works very well. We were able to classify all the numbers in the video with very high accuracy.
Was it reliable?
Our strategy was reliable. Using perspective transforms, we were able to detect the numbers from different angles and reasonable distances consistently and accurately.
In what situations did it perform poorly?
Our strategy performed poorly when the numbers were very far away from the camera or when the Duckiebot was moving. To mitigate these issues, when we get within a certain distance from an AprilTag, we stop the Duckiebot and take a picture of the number for classification. Some of the misclassifications in the video were due to AprilTag detection inaccuracies, where the AprilTag library misreports the AprilTag’s position as closer than it really is. We could mitigate this issue by slowing down the Duckiebot when it first detects an AprilTag, and waiting for a second detection to confirm the AprilTag’s position prior to capturing the image for number detection.
Sources
- NN-SVG
- Wikipedia MNIST database
- Pytorch MNIST example
- Pytorch Data Random Split
- OpenCV Warp Perspective
- Stack Overflow How to force approxPolyDP() to return only the best 4 corners? - Opencv 2.4.2
- OpenCV Contours and Convex Hull
- OpenCV Docs
- Stack Overflow Getting corners from convex points
- Stack Overflow Image processing - I need to find the 4 corners of any quadrilater
- Stack Overflow Detect card MinArea Quadrilateral from contour OpenCV